
Big Data is a massive amount of information that is pulled from a wide variety of sources and delivered to you with incredible speeds. We’ve already heard the spiel before, but the question remains: what resources are available out there that work best with Big Data?
Fortunately for fans of Big Data, there are dashboards to help with this chore. What’s a Big Data dashboard and how can it help end user? Read on.
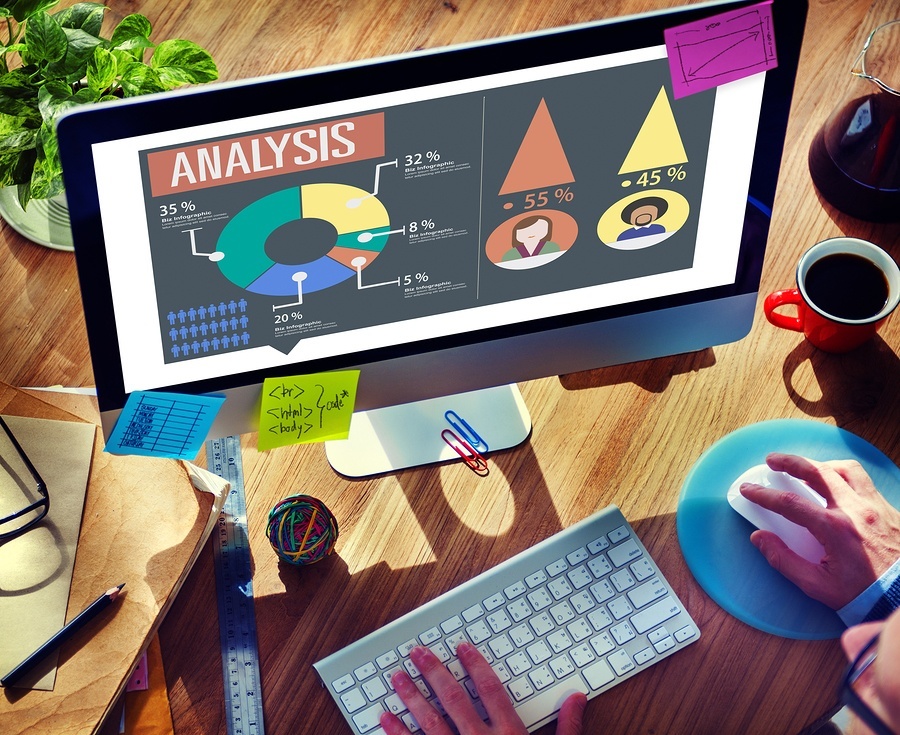
Big Data is best digested with a data dashboard
What’s A Big Data Dashboard?
Anyone who’s ever driven a car knows what a dashboard is. It’s where you have things displayed like the speedometer, odometer, fuel gauge, temperature, and cool stuff like the stereo system and environmental controls. Okay, so far so good.
A Big Data dashboard pops up on your system’s display and employs data visualization to show company metrics. You can bring in CRM systems, sales spreadsheets, accounting software, and website analytics if the dashboard is used in conjunction with an application programming interface (or API for short).
Bottom line, it’s a real-time display of your company’s valuable information, bringing it all together to one spot.
Interactive Dashboards Rule
The article “Expert Interview With Donald MacCormick From Antivia.com On Big Data Dashboards” points out that dashboards have evolved. Once upon a time, dashboards were static, delivering performance information, but with no allowance made for follow-up questions.
Today’s dashboards have an interactive element, so they not only provide the figures, but also allow the end user to ask some specific questions about the data, breaking down the figures by region, or product, or some other qualifiers.
End users can get real-time functionality out of today’s Big Data dashboards.
A Variety Of Dashboards
The beauty of today’s Big Data dashboards is that they come in so many different forms, depending on which department in your company needs it, or what use the data will be put to. For instance, there are Marketing, Sales, Operations, and Support dashboards.
This selection allows dashboards to be used by a greater number of end users, providing versatility across a variety of departments.
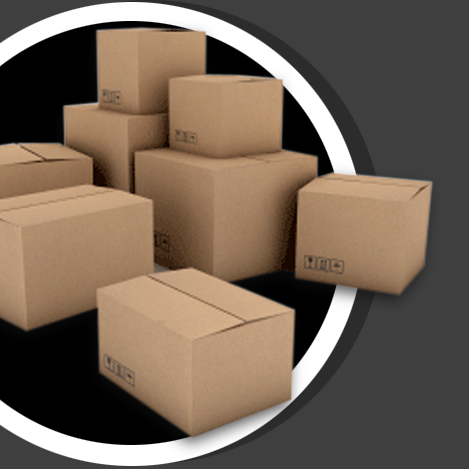
Product Tracking
Let’s highlight one of the biggest uses for Big Data dashboards: tracking products from the warehouse to the consumer. Using a dashboard, an end user can track a product through the supply chain (thereby keeping an eye on inventory levels), and pull up figures regarding its popularity among consumers, and even keeping track of feedback and customer satisfaction. Imagine having all of that data on a product’s life, from start to finish, collected in one place and easily accessible.
The Back End Matters Too
Here’s an inescapable fact: a Big Data dashboard is only as useful as the back end data allows. That’s why end users who want to get the most out of their data dashboard need to make sure that their data warehouse is in order, with data that’s been cleaned up and organized. Remember that the dashboard is simply a means of presenting the data; if the data is bad, the results will be as well. This harkens back to one of the classic axioms of the computer world: “Garbage in, garbage out”.
Big Data is all the rage today. A business that wants to take advantage of it and put it to the best use possible would be well-advised to look into factoring Big Data dashboards into their plans. For more insights into Big Data, read “How To Make Big Data Work In Your Business.”


